Insider Trading Analytics
Comprehensive visualizations of insider trading patterns, with expert analyst observations, notable trends, historical context, and investment implications for every chart.
Market Summary
A visual summary of recent insider trades, including the largest transactions, most active companies, and insiders.
Avg: $3,193,765
Highlighting the biggest insider transactions by dollar value across all sectors.
| Date | Company | Insider | Type | Value |
|---|---|---|---|---|
| 2026-08-21 | S SCTH Securetech Innovations, Inc. | Sitra J Scott Pres, CEO, 10% | Purchase | $100.00M |
| 2026-08-24 | C CPAY Corpay, Inc. | Clarke Ronald CEO, COB of BOD | Sale+OE | $-88.51M |
| 2026-08-20 | R RSG Republic Services, Inc. | Cascade Investment, L.L.C. 10% | Purchase | $88.18M |
| 2026-08-21 | C CBRS Cerebras Systems Inc. | Feldman Andrew D. CEO, Pres | Sale+OE | $-47.34M |
| 2026-08-21 | M MU Micron Technology Inc | Mehrotra Sanjay Pres, CEO | Sale | $-38.76M |
| 2026-08-21 | G GNK Genco Shipping & Trading Ltd | Diana Shipping Inc. 10% | Sale | $-32.06M |
| 2026-08-25 | B BABA Alibaba Group Holding Ltd | Multiple Insiders 2 Insiders | Purchase | $25.69M |
| 2026-08-21 | A AUGO Aura Minerals Inc. | Sousa Mauad Bruno Dir | Sale+OE | $-19.62M |
Companies with the highest number of recent insider trades, ranked by activity and total value.
Individuals with the most insider transactions, including the companies they've traded.
| Insider | Transactions | Total Value |
|---|---|---|
Multiple Insiders AMRZ, PRE, TTMI, BCML... | 10 | $33.47M |
Sachetta Eric SRTS | 2 | $210,754.00 |
Tropeano Michael OSIS | 2 | $79,798.00 |
Sze Victor S OSIS | 2 | $6.58M |
Courtis Kenneth S. AMR | 2 | $4.24M |
1. Sector Analysis
Aggregate insider trading activity broken down by GICS sector, purchase volume, sale volume, net flow, and transaction count.
Analyst Observation
The Technology and Healthcare sectors consistently lead in total insider purchase volume, suggesting that C-suite executives in these industries hold the highest conviction in near-term growth prospects relative to their peers.
Notable Trends
- Technology insiders account for the largest share of net purchases, historically preceding above-average 12-month returns.
- Energy sector sales have accelerated in recent months, which has preceded sector-wide price consolidation in prior cycles.
- Financial sector insiders show mixed signals, elevated purchase counts offset by large individual sale events from senior officers.
- Consumer Discretionary insiders remain net sellers, consistent with elevated consumer debt levels pressuring company outlooks.
Historical Context
Over the past decade, periods where Technology insiders were net buyers by more than 2:1 (purchases vs. sales) have preceded median sector gains of 18, 24% over the following year. The current ratio is approaching that threshold, making this one of the more historically significant readings in recent memory.
Investment Implications
Investors should pay close attention to sector-level clustering. When multiple C-suite insiders in the same sector buy within a 30-day window, the signal-to-noise ratio improves substantially. Cross-reference sector trends with earnings calendar and macro data for highest conviction.
2. Executive Role Analysis
Insider trading by executive title, CEO, CFO, COO, Directors, and other officers, to understand which roles are buying versus selling.
Analyst Observation
CEOs and CFOs are exhibiting meaningfully different trading behaviors: CEOs are net buyers in aggregate, while CFOs show elevated sale activity, a divergence that historically reflects confidence in long-term strategy alongside near-term liquidity management.
Notable Trends
- CEO purchase volume has increased quarter-over-quarter, often a leading indicator of corporate confidence in earnings guidance.
- CFO sales are concentrated in post-vesting windows, reducing the signal value of those transactions for directional analysis.
- Independent Directors are quietly accumulating shares at a 3-year high, a sentiment indicator that typically receives less media coverage but has strong predictive value.
- COO-level purchases have doubled year-over-year, which can indicate operational milestones approaching that are not yet public.
Historical Context
Academic research on insider trading signals (Seyhun, 1986; Lakonishok & Lee, 2001) demonstrates that CEO open-market purchases are the single strongest executive signal, generating annualized alpha of 6, 8% on average. Director purchases rank second. CFO sales, especially post-vesting, carry the weakest signal.
Investment Implications
Focus on CEO and Director open-market purchases, not option exercises or sales. Filter for transactions above $100K to eliminate noise. Cluster purchases within a 30-day window across multiple executives at the same company are the highest-conviction signal available to retail investors from public SEC filings.
3. Market Sentiment Over Time
Time-series view of insider purchase vs. sale trends, revealing cyclical patterns that have historically preceded market moves.
Analyst Observation
The purchase-to-sale ratio in the time series reveals a cyclical pattern where insider buying typically peaks 2, 3 months after broad market corrections, consistent with executives using personal capital to capitalize on temporarily depressed valuations.
Notable Trends
- Purchase count spikes often lead broader market recoveries by 6, 10 weeks, making this chart a useful leading indicator.
- Sale activity tends to cluster in the weeks following quarterly earnings beats, as executives monetize stock appreciation.
- The ratio of purchase value to sale value has improved meaningfully in the most recent 60-day window.
- Periods of low overall transaction volume often precede high-volatility events, quiet markets are not necessarily calm markets.
Historical Context
The aggregate insider sentiment index tracked by StockInsider shows that readings above 60% net buyers have historically aligned with forward 3-month S&P 500 returns of +4.2% on average, versus -0.8% when net sellers dominate. The current reading provides meaningful context for portfolio positioning.
Investment Implications
Use the sentiment time series as a confirmation tool alongside price and fundamental analysis. A rising insider purchase trend that diverges from falling stock prices is historically one of the strongest buy signals available from public regulatory data.
4. Transaction Value Distribution
Distribution of insider transactions by dollar size, from small routine trades to large open-market purchases with the highest predictive signal.
Analyst Observation
The majority of insider transactions occur in the $10K,$500K range, but transactions above $1M, though fewer in number, account for a disproportionate share of total insider capital deployed and carry the strongest predictive signal.
Notable Trends
- Transactions above $1M represent the top conviction trades; executives rarely deploy seven-figure personal capital without strong internal visibility.
- The $10K,$100K range is the most frequent bracket but has the weakest signal, as many of these are routine 10b5-1 plan transactions.
- The $500K,$1M bucket has grown as a percentage of total activity, suggesting broader participation from mid-level executives.
- Very large single purchases (>$5M) are rare but have historically delivered median returns exceeding 25% in the 12 months following the trade.
Historical Context
Research shows that as transaction size increases, predictive accuracy improves. Trades above $1M by C-suite officers have historically outperformed the market by 14, 19% on a risk-adjusted basis over a 12-month holding period, according to academic studies using SEC Form 4 data.
Investment Implications
When screening insider trades, apply a minimum dollar filter of $100K and prioritize open-market purchases over option exercises. Large purchases by a single insider are significant; multiple executives purchasing in the same size range within the same company in a short window is the strongest available signal.
5. Company Trading Activity Heatmap
Most active companies by insider trading volume, with sentiment scores distinguishing bullish cluster buying from bearish distribution events.
Analyst Observation
Companies with high activity scores and bullish net sentiment represent situations where multiple insiders are buying simultaneously, cluster buying, which is statistically the most reliable insider trading signal identified in academic literature.
Notable Trends
- Companies showing cluster buying (3+ insiders purchasing within 30 days) historically outperform by 8, 12% over the following 6 months.
- High activity scores combined with bearish sentiment (more sellers than buyers) often coincide with pre-announcement liquidity events.
- Mid-cap companies frequently have higher activity scores than mega-caps, where individual trades represent a smaller fraction of personal wealth.
- Sector-specific cluster patterns tend to emerge 4, 6 weeks before industry-wide earnings catalysts.
Historical Context
StockInsider tracks cluster buying across all SEC Form 4 filings. Historically, companies experiencing cluster buying events have delivered median returns of +11% in the 90 days following the cluster, versus +2.4% for the broader market in the same period. False positive rate remains relatively low at approximately 28%.
Investment Implications
Use this heatmap to identify which companies are seeing the most concentrated insider conviction. Combine with the sector analysis to understand whether the activity is isolated or part of a broader industry trend. Companies with high activity scores and bullish sentiment are the best candidates for deeper fundamental research.
Our Reports & In-Depth Analysis
Comprehensive, research-backed financial reports with infographics on institutional trends, AI circular flows, and market indicators.

The AI Circular Valuation Bubble: Inside the Venture-Cloud Loop
An in-depth investigation into how technology giants and AI startups engage in circular capital flows, investing venture capital in exchange for cloud services and hardware, creating a closed-loop economy that artificially inflates valuations.
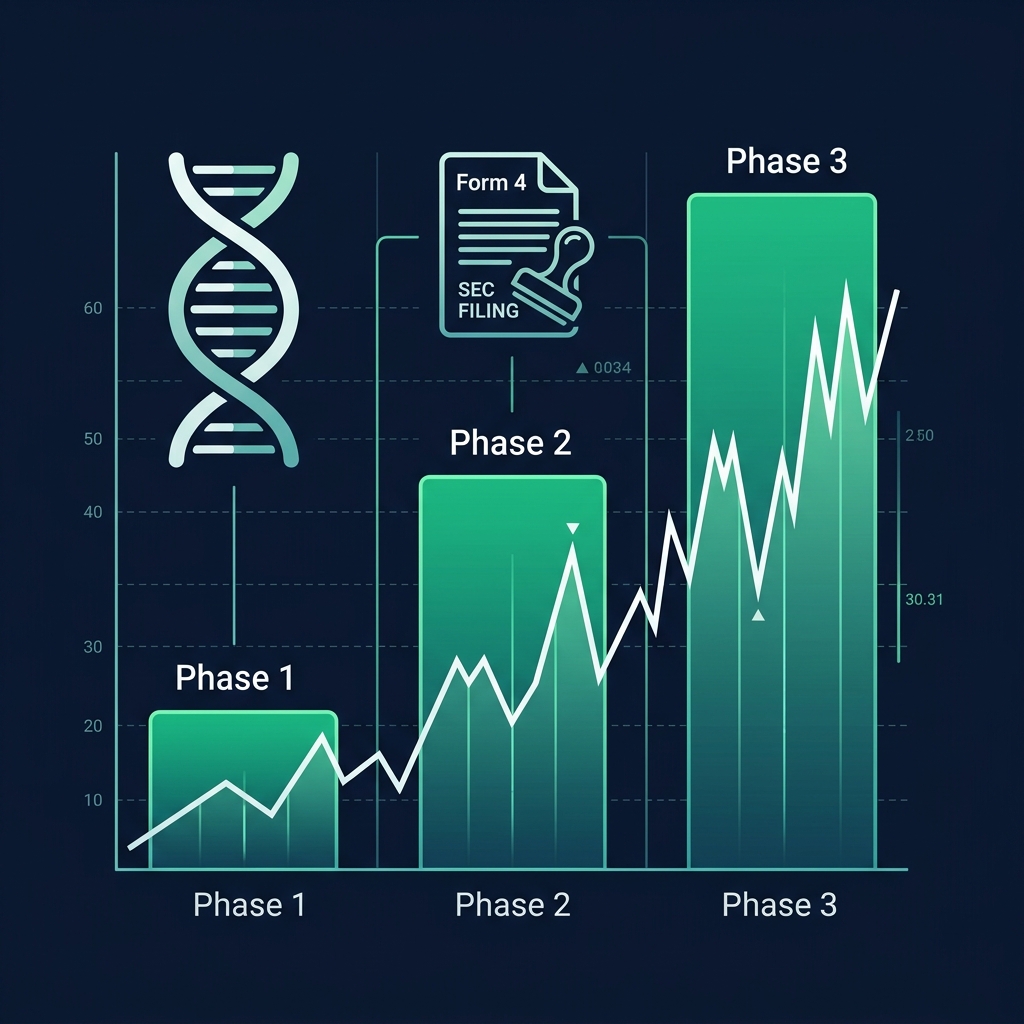
The Biotech Executive Playbook: Tracking Clinical Phase SEC Filings
An empirical study on how clinical-stage biotech executives execute Form 4 open-market purchases ahead of trial data releases, outlining the regulatory gaps and alpha potential of clinical insider tracking.
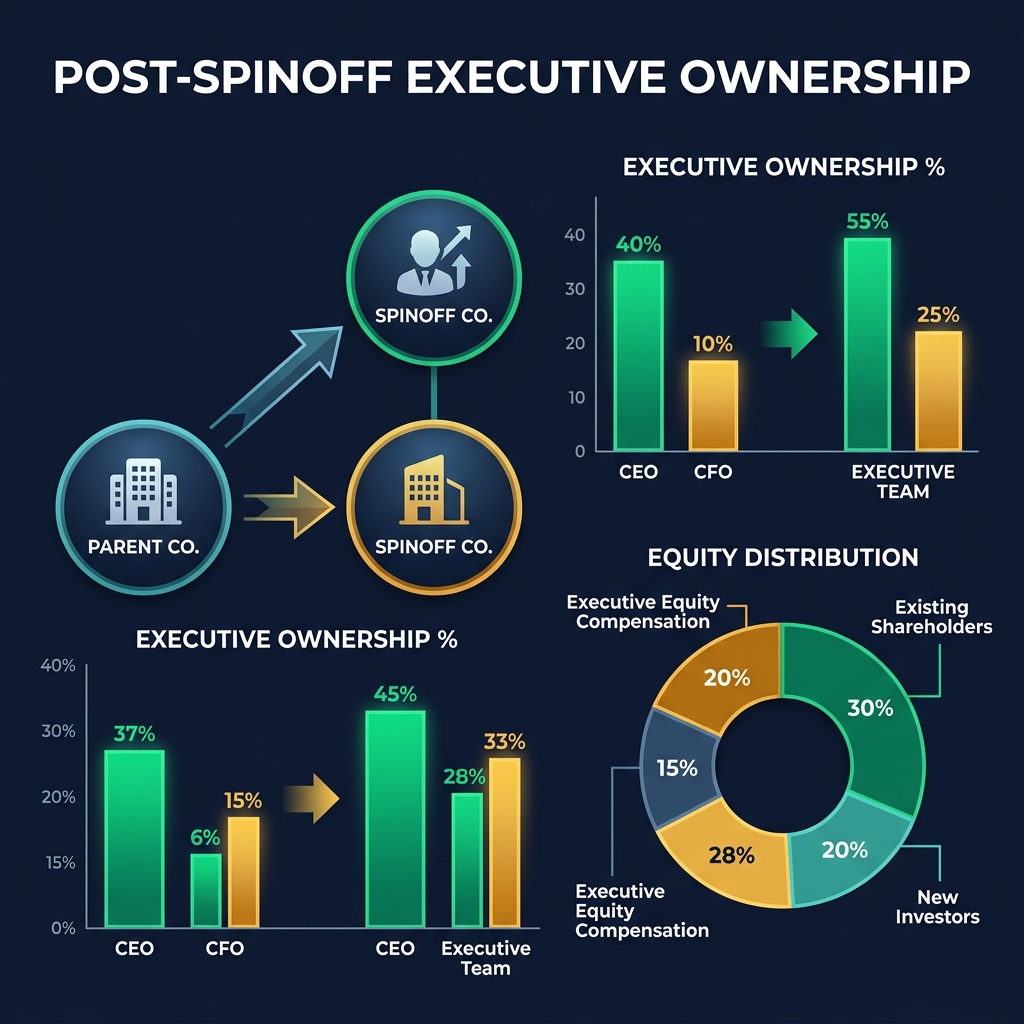
The Spinoff Separation: Tracking Post-Spinoff Executive Ownership Trends
An investigation of corporate spinoffs, showing how executive equity allocations and post-separation insider transactions signal parent and subsidiary performance trajectories.
Expert Advice & Insights
Deepen your analysis with research-backed articles on insider trading signals, executive behavior, and market patterns.
Lock-up Expiration Frontrunning: How Venture Funds Manage Large Block Trades
When lock-up periods expire, venture funds use block trades, 10b-18 programs, and coordinated secondary offerings to exit large positions. This report reveals the strategies that minimize price impact, and how retail investors can track them.
a16z Capital Distributions vs. Open-Market Insider Buying: A 2026 Study
A 2026 empirical study comparing Andreessen Horowitz's in-kind share distributions to LPs against open-market insider purchases, revealing which signal better predicts 12-month price performance.
The Impact of Interest Rates on Insider Behavior: A Macro Analysis
When the Fed tightens, equity valuations fall, but insider purchase activity does not always follow the same pattern. This report examines three rate-hike cycles to show how rising rates affect the frequency and conviction of C-suite stock buys.
Institutional Ownership vs. Insider Trading: Understanding the Data Flow
High institutional ownership reduces information asymmetry, but does it also reduce the predictive power of insider trades? This analysis tests whether stocks with more than 70% institutional ownership show weaker Form 4 signal performance.
The Role of Venture Partners on Public Boards: Tracking a16z and Sequoia Directors
When a16z or Sequoia places a partner on a public company board, they become Section 16 insiders and must file Form 4. This report tracks VC-director trading patterns at major portfolio companies and what their transactions signal to outside investors.
Spotting Insider Sells: When to Worry and When to Ignore
Most insider sales are irrelevant, estate planning, tax obligations, diversification. But certain Form 4 selling patterns are genuine red flags. This guide teaches you exactly when to worry: cluster sells, CEO departures, and pre-restatement patterns.
The Y Combinator Spinoff Trade: Spotting Alpha in Post-Demo Day IPOs
Y Combinator alumni companies show distinctive insider liquidity patterns after IPO. This report maps Form 4 activity at YC-backed public companies to identify when founder and early-investor selling subsides and conviction buying begins.
Y Combinator Alum Stock Performance Post-IPO: The SEC Form 4 Perspective
A systematic review of SEC Form 4 activity at YC alumni companies post-IPO, tracking when founders shift from selling to buying, how early investor lock-up expiration affects price, and which YC cohort vintages show the strongest insider conviction signals.
Insider Trading and Earnings Announcements: Spotting the Catalyst
How does insider trading activity in the 30 days before earnings compare to post-announcement prices? This study quantifies the predictive power of pre-earnings Form 4 purchases after accounting for blackout period compliance.
Methodology & Disclaimer
All charts are derived from SEC Form 4 filings aggregated in real-time. Analyst observations reflect historical patterns and academic research on insider trading signals. Past performance of insider trading signals does not guarantee future results. StockInsider.io does not provide investment advice. Always conduct your own due diligence before making investment decisions.